From Data to Decision: Why Cyclistic Needs UX Research, Rather than a Campaign

Executive Summary:
As a project for the Google Data Analytics Certificate, this analysis examined 12 months of Cyclistic bike share trip data across 3.7 million cleaned rides to understand how casual riders and annual members use the service differently.
The data revealed two distinct user groups with fundamentally different relationships with the product:
Members are reliable, year-round commuters whose behavior holds steady across every season.
Casual riders are experience seekers concentrated in summer, active on weekends, and clustered around Chicago's most iconic destinations.
While the data is specific enough to sketch a campaign targeting casual riders by time, location, and season, it cannot answer the most important question: why they ride. Without understanding casual rider's motivations, any campaign risks being generic, forgettable, and impossible to learn from. I recommend a phased UX research strategy starting with jobs to be done interviews, moving into evidence based segmentation, and using those findings to build a campaign that will resonate.
Research goal
As a project for the Google Data Analytics Certificate, the goal was straightforward: analyze 12 months of bike share trip data across more than 5,800 bikes and 600 docking stations, covering 5 million rows of raw trip records for a fictional Chicago company called Cyclistic, and figure out how to convert casual riders into annual members.
Cleaning the data
Before any analysis could happen, I had a scale problem to solve.
The raw dataset spans 12 months of trip records across Chicago's bike share network. Combined, that's roughly 5 million rows of data. Opening that in a spreadsheet wasn't a serious option.
First, I uploaded all 12 CSV files to Google Cloud Storage then loaded them into BigQuery using wildcard URIs, which meant the entire year stacked into a single master table automatically, no manual merging, no copy paste errors, no version confusion. From there, BigQuery became the cleaning and aggregation engine.
The cleaning process had three meaningful steps.
Rows missing a start or end station identifier were removed. These records were incomplete and couldn't contribute anything reliable to the analysis.
Before running any aggregations, I conducted a primary key integrity audit on the ride_id field to check for cross month logging overlaps or double entries. The audit confirmed that ride_id maintained 100% uniqueness across the entire population, confirming the raw data was clean before I used it.
I audited and filtered the ride duration outliers. When the initial summary statistics came back, the average trip duration and the median were disconnected, a statistical red flag. I found multi hour and overnight trips that turned out to be undocked bikes and system maintenance entries, not real user journeys. A boundary filter was applied, removing any trip under one minute and any trip exceeding 24 hours. This brought the dataset down to 3,782,579 clean rides.
Finally I used RStudio for the visualizations, pulling from lightweight pre-aggregated summaries rather than the full raw table.
Understanding our segments

Starting from a high-level and working through the details helps to see the full picture. Across an entire year, two very different usage patterns appeared. Members maintain a higher volume every month. Casual riders are nearly absent in January and February, then steadily increased through spring until they surge in summer, narrowing the gap with members before falling again in the fall.

Monday through Friday, member ridership is high, consistent, and then drops considerably on weekends. Casual riders do the opposite. They dip mid week and surge on Saturdays and Sundays, nearly matching member volume by Saturday.

Across all four seasons, members show the exact same pattern: sharp spikes at 8am and 5pm, every single day, regardless of whether it is January or July. The volume scales up and down with the weather but generally the shape never really changes, indicating members are using riding to and from work. Members have built Cyclistic into their daily routine in a way that weather, season, and circumstance don't disrupt.
Casual riders on the same chart tell the opposite story. Their curve builds slowly through the morning, peaks in the afternoon, and tapers into the evening. And in winter their volume nearly disappears entirely while members keep showing up.
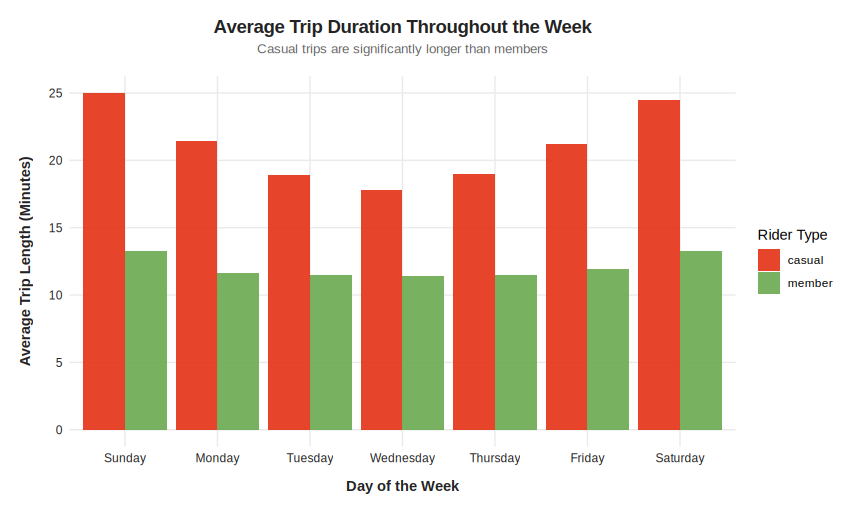
Casual riders ride longer than members every single day of the week, averaging around 21.6 minutes per trip compared to a member average of about 12 minutes. But what's more interesting than the gap is the shape of the member line; it's almost completely flat across all seven days, hovering between 11 and 13 minutes regardless of whether it's a Tuesday or a Sunday.

After plotting both groups on the same scale, something interesting appeared. Both casual riders and members predominantly take trips under 20 minutes. On the surface that looks like similar behavior. The member curve peaks sharply and drops off cleanly.

But zooming into only trips over 20 minutes, the casual curve is lower, wider, and has a long tail stretching well past 20 minutes. Members are highly predictable. Casual riders are scattered across a much broader range of trip lengths.
Campaign for Casual Riders

To create the campaign, I needed to learn when and where to reach the casual riders. Building steadily through the morning, casual ridership peaks in the afternoon between 3pm and 5pm, and tapers gradually into the evening. The shape of the curves suggests a different relationship with cyclist. There's no commute spike in the morning, no sharp drop after 5pm.
Whether a digital ad, a social media push, or an in person event, any campaign activation, should be concentrated in this afternoon window during warmer months when casual ridership is at its highest. And because I know exactly when casual riders are most active, in person activations become especially valuable. Meeting riders while they are already engaged with the product is the best time to ask questions. The further people are from an experience, the more they reconstruct it rather than remember it. Catching someone in the moment gives you insights that are still fresh, unfiltered, and not yet rationalized.

Every single high traffic station for casual riders sits at a tourist destination, a waterfront, or a cultural landmark. Navy Pier, DuSable Lake Shore Drive, Millennium Park, Shedd Aquarium.
Fun fact: During a trip to Chicago I rented a bike from Millennium Park and rode it straight to Navy Pier, so I guess this makes me a casual rider too!
The locations tell us a few things about who casual riders are. They are drawn to experiences, choosing destinations with scenery, culture, and things to see rather than places to be.
This makes Navy Pier, DuSable Lake Shore Drive, and Millennium Park the obvious starting points for any in person campaign activation. We know the audience shows up there. We know when they peak. This is a strong enough foundation to start a conversation.
A UXR's Perspective
Before any campaign launches, there is one question worth sitting with first.
Look back at those station locations. Navy Pier. Millennium Park. DuSable Lake Shore Drive. These are not neighborhood spots. They are some of the most visited tourist destinations in Chicago. Which raises an uncomfortable possibility:
What if a large portion of our casual riders are not Chicago residents at all? What If they are tourists?
They might be visiting for a few days and have a completely valid reason for never becoming annual members. These bikes are local. A membership only makes sense if you live here.
That changes the math on conversion significantly. And it is something the data cannot tell us. We do not know how many casual riders are tourists, how many are locals who ride occasionally, how many have thought about a membership and decided against it, or how many have never considered it at all.
We also don't know what happens to riding behavior after conversion. If a casual rider becomes a member and starts riding like one, shorter trips, more routine, less exploratory, the business needs to confirm that the annual fee outweighs the per trip revenue being replaced.
These are the questions that determine whether a campaign is worth running at all, and the only way to answer them is to talk to people.
Here's the UXR Strategy I propose:
Phase 1: Jobs to Be Done Interviews
The most important thing we do not know about casual riders is what they are actually trying to accomplish when they ride. The data tells us they show up on weekend afternoons at Navy Pier and Millennium Park and stay out for 20 plus minutes.
Are they out with friends? Exploring the city? Getting exercise? Avoiding a crowded train? Trying to sober up before driving home? Each of those motivations points toward a completely different conversion message.
Jobs to be done interviews with casual riders, ideally recruited through those in person activations at high traffic stations during peak afternoon hours, would give us the motivational foundation that the behavioral data cannot provide. With this information, we would be building a campaign with a message that resonates.
Phase 2: Segmentation
Casual rider versus member are essentially business constructs. Using the motivation and behavioral insights from the interviews, we can segment the cyclist in a meaningful way. Creating real human segments that tell us why people ride and what loyalty could look like for them.
A casual rider could be a tourist seeing the city for the first time, a local who rides every weekend, or someone who has been thinking about a membership for months but never followed through.
None of those segments are visible in the data. They are hiding behind the label casual rider. Research is what will make them visible.
Phase 3: Everything Downstream
Segments built on real human insight change everything that follows. The campaign becomes more targeted because we know who we're talking to and what they actually care about. The product team gets a clearer brief because you can articulate specific friction points real riders described. Partnership opportunities become more obvious because you understand the contexts casual riders are already operating in. And if the data eventually suggests that certain casual riders will never convert to a standard annual membership, the research might surface what product or pricing innovation would actually serve them instead.
Final Thoughts
I came back to this project to prove something to myself, that with better tools and a clearer lens the story in the data would get sharper. It did. But more than the technical growth, what surprised me was how quickly the analysis moved from answering the brief to questioning it. That tension is what made this worth revisiting.
If you have worked with behavioral data, conducted similar research, or just have a tip or two to pass along, I would love to hear from you. Leave a comment below.
Tools Used
R (RStudio), Google BigQuery, Google Cloud Storage, Gemini, Claude


Comments